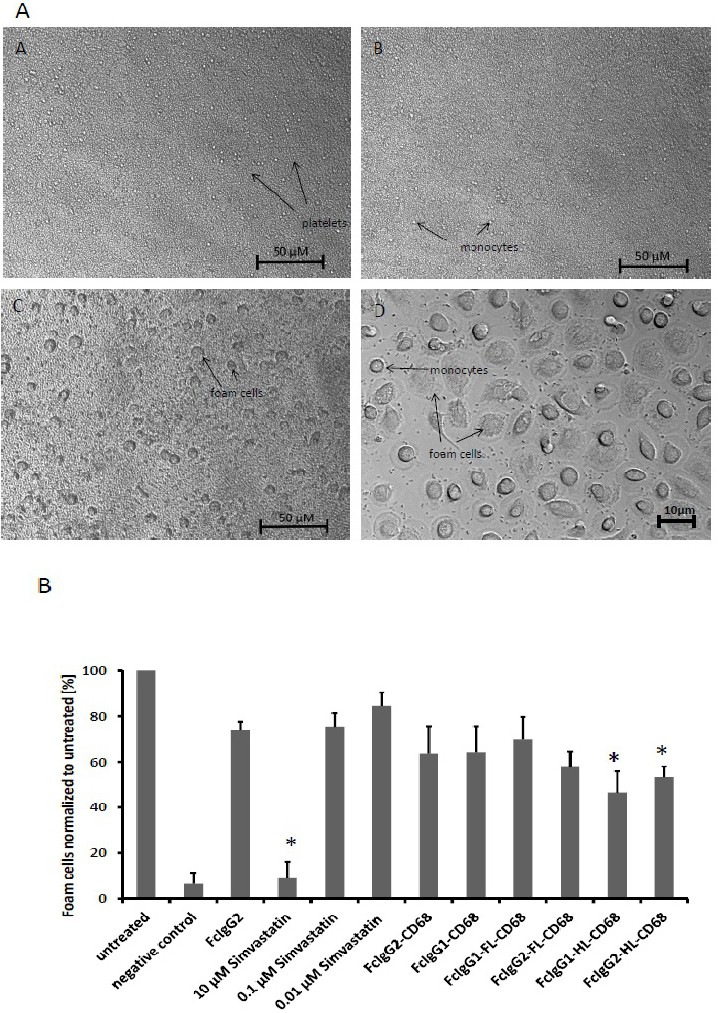
Fig. 3. (A) Representative images of a foam cell assay. A: Co-culture of thrombocytes and monocytes at t = 0. B: In the presence of 10 µM Simvastatin after 96 h incubation only few differentiated cells (macrophages and foam cells) are visible. C: After 96 h of incubation without any additional substance macrophages and foam cells differentiate whereas platelet decrease in number. D: In higher magnification monocytes and foam cells can be clearly distinguished after 96 h of co-culture. Only few monocytes and platelets remained. Bars indicate the scale at different magnifications. (B) Inhibition of foam cell formation by Fc-CD68 proteins. The quantification of foam cells with co-culture of human monocytes and platelets was performed counting foam cells under the microscope. Mean values of 5 randomly selected, equally sized areas of the 10 cm culture dish are shown from. The Means ± SEM of 4 independent experiments are shown.